Using RMarkdown
Last updated on 2025-11-11 | Edit this page
Estimated time: 12 minutes
Overview
Questions
- How do you write a lesson using R Markdown and sandpaper?
Objectives
- Explain how to use markdown with the new lesson template
- Demonstrate how to include pieces of code, figures, and nested challenge blocks
Introduction
This is lesson, created follwing The Carpentries Workbench, is meant to be an introduction to learning how to work with timeseries datasets in R.
There are three sections that will appear at the start of every lesson:
-
questionsare displayed at the beginning of the episode to prime the learner for the content. -
objectivesare the learning objectives for an episode displayed with the questions. -
keypointsare displayed at the end of the episode to reinforce the objectives.
To successfully participate in this course, we ask that participants meet the following prerequisites:
- Have an understanding of how file explorer works - creating folders, how to access and download files and moving them into the approriate folder (uses daily)
- Be able to use and download files from internet (uses daily)
- Be able to open, use basic functions, and edit in excel (uses weekly - monthly)
- Some very basic statistical knowledge (what is a mean, median, boxplot, distribution etc.) (any previous use)
- An overall understanding of why timeseries data is important (any previous use)
- Basic R: they have opened it, made projects, used basic functions (View, summary, mean, sd, etc.) and can load a dataset and install packages (any previous use)
- R coding: Base R: understanding of aggregrate() and some experience with tidyverse (has used at least twice before)
Inline instructor notes can help inform instructors of timing challenges associated with the lessons. They appear in the “Instructor View”
Challenge 1: Can you do it?
What is the output of this command?
R
paste("This", "new", "lesson", "looks", "good")
OUTPUT
[1] "This new lesson looks good"Challenge 2: how do you nest solutions within challenge blocks?
You can add a line with at least three colons and a
solution tag.
Figures
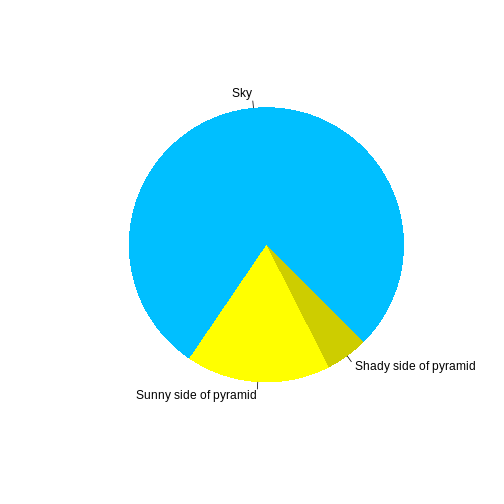
You can also include figures generated from R Markdown:
R
pie(
  c(Sky = 78, "Sunny side of pyramid" = 17, "Shady side of pyramid" = 5),
  init.angle = 315,
  col = c("deepskyblue", "yellow", "yellow3"),
  border = FALSE
)
Or you can use standard markdown for static figures with the following syntax:
{alt='alt text for accessibility purposes'}
Callout sections can highlight information.
They are sometimes used to emphasise particularly important points but are also used in some lessons to present “asides”: content that is not central to the narrative of the lesson, e.g. by providing the answer to a commonly-asked question.
Math
One of our episodes contains \(\LaTeX\) equations when describing how to create dynamic reports with {knitr}, so we now use mathjax to describe this:
$\alpha = \dfrac{1}{(1 - \beta)^2}$ becomes: \(\alpha = \dfrac{1}{(1 - \beta)^2}\)
Cool, right?
- Use
.mdfiles for episodes when you want static content - Use
.Rmdfiles for episodes when you need to generate output - Run
sandpaper::check_lesson()to identify any issues with your lesson - Run
sandpaper::build_lesson()to preview your lesson locally